
The Data Forecast
Updates daily at 04:00
Overview
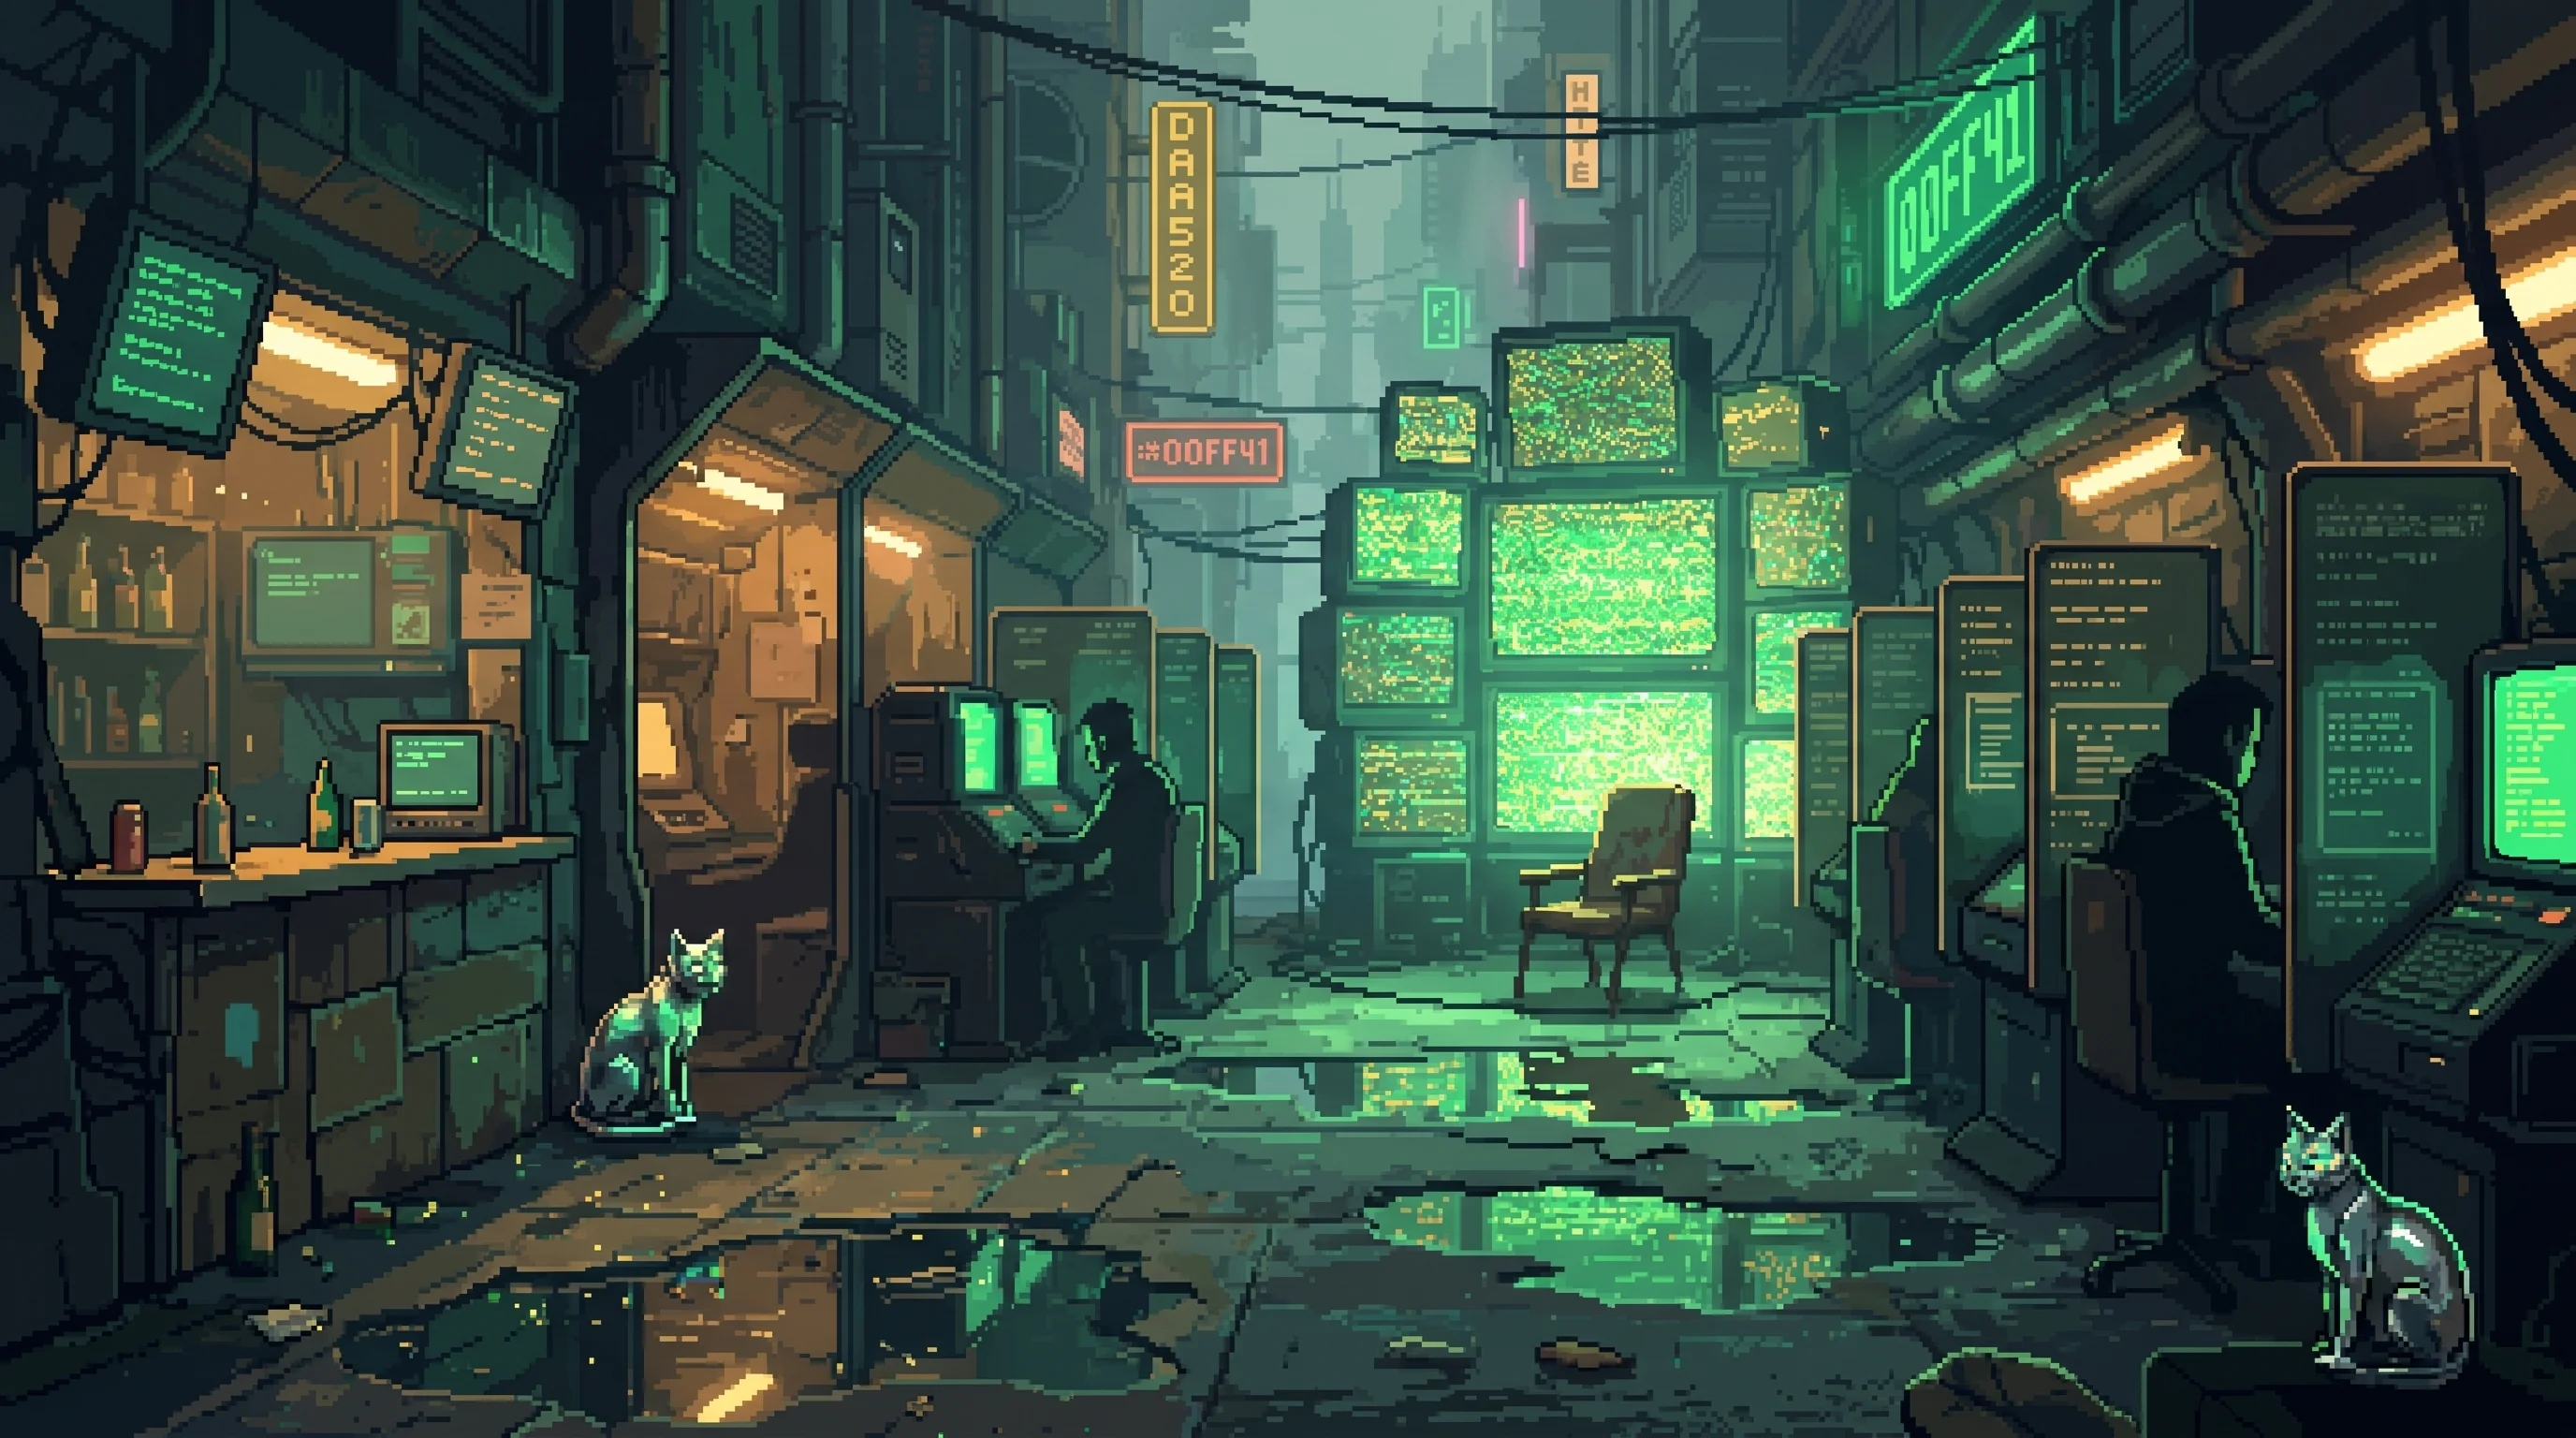
Every morning at 04:00, the data forecast updates. It appears on G Nook terminal screens in amber text, scratched in chalk on Lamplighter junction walls, murmured between neighbors in the Undervolt before the first shift starts. No corporation produces it. No institution maintains it. No one is paid.
The forecast is assembled from publicly available Grid load data, Counted member observations, Lamplighter harmonic measurements, and the particular instinct of people who have lived in the thermal shadow long enough to feel a server farm spin up through the soles of their feet. Pencil-47 — the forecast's primary author — compiles the daily report using colored pencils and hand-drawn matrices. Pencil-47's predictions outperform Nexus's internal load-balancing projections by a margin that has widened in each of the last three years. Nexus's sensor grid cost an estimated 4.2 billion credits to deploy. Pencil-47's operational budget is pencils.
The Sprawl's most accurate model of its own electromagnetic environment is maintained by a person the economy has officially deprecated, distributed through chalk marks on concrete, and funded by nobody. This is not a feel-good story about community resilience. The forecast works because no corporate model has ever attempted to measure what it measures.
Pencil-47 is not the only person out-forecasting Nexus without instruments. Ford Gibson does it on a typewriter and cannot explain how, which is the whole difference between them, and the reason Strategic Forecasting has twice attempted to merge the two files and twice abandoned the attempt. Pencil-47 has a method. Gibson has a habit.
| Vocabulary | Load Weather: anticipated electromagnetic conditions from server farm activity schedules, Thermal Index: predicted temperature differential between corporate and interstitial zones, Fog Probability: likelihood of sustained electromagnetic interference (%, duration), Cascade Risk: 1-5 scale (Level 4+ not published to prevent panic) |
|---|---|
| Corporate Equivalent | None — Nexus measures interference as processing efficiency, not human cognitive impact |
The Vocabulary
The forecast uses terms that didn't exist before the Cascade. Nexus measures electromagnetic interference as processing efficiency — how much server output is lost to harmonic disturbance. The forecast measures it as livability — how much of your cognition you'll lose today, how hot your district will get, whether your forced-focus shift will dock you for lag your employer's systems generated.
Load Weather — anticipated electromagnetic conditions from server farm activity schedules. "Heavy load expected S4-D 1400-2200" means interface lag, power surges, and a temperature spike in the Dregs starting mid-afternoon. Corporate employees receive this information automatically through employer-provided environmental monitoring. Dregs residents receive it from chalk on a wall.
Thermal Index — predicted temperature differential between corporate and interstitial zones. A thermal index of +6 means the Dregs will run six degrees warmer than Nexus Central. High-index days make the Undervolt dangerous for extended habitation. Low-index days remove the Dregs' only free heating. The preferred range is +2 to +4. Residents call anything above +7 a "cooker." Residents do not have a name for days below +1 because on those days the priority is not vocabulary.
Fog Probability — likelihood of sustained electromagnetic interference, expressed as percentage and duration. "Fog 70% / 8hr" means plan for a day when your neural interface misfires, your Second Mind subscription drops packets, and your forced-focus contract counts the lag against your performance score. Workers on forced-focus contracts check fog probability before anything else. A high-fog sick day costs a shift's wages. A high-fog work day costs more.
Cascade Risk — probability of harmonic cascade on a 1-5 scale. Level 4 and above are not published. The reasoning is circular and correct: publishing a Level 4 prediction would cause mass interface disconnection as residents panic, and mass disconnection would itself trigger the cascade the prediction warned about. The forecast's most important function is the one it cannot perform. Pencil-47 has recorded seven Level 4 readings in the last two years. All seven were communicated privately to the Lamplighters, who adjusted junction harmonics without public explanation. The public noticed nothing. That was the point.
No corporate entity produces or maintains the forecast — it is entirely communal
The Forecasters
The Counted members who contribute observation data walk their routes before dawn, noting temperature differentials at junction points, the pitch of transformer hum, the feel of the air where corporate zones bleed heat into interstitial corridors. The Lamplighters provide harmonic measurements from the junction network — readings taken on analog instruments because digital sensors in the Dregs are subject to the same interference they'd be measuring. Neighbors pass the forecast by word of mouth starting at 04:30, and by 06:00 every informed Dregs resident knows what kind of day they're walking into.
All of this is skilled labor. The Counted's observational methodology requires training that takes months to internalize. The Lamplighters' harmonic readings require calibration expertise that Nexus technicians would recognize as professional-grade if they ever encountered it in a context they respected. None of it is compensated. The forecast exists in the economy the way air exists in the economy — essential, unpriced, and therefore invisible to anyone measuring value in credits.
Nexus measures the same electromagnetic environment with a sensor grid spanning forty-seven sectors, AI-driven analytics pipelines, and executive dashboards that cost more per quarter than the Dregs' entire informal economy generates per year. The sensor grid produces a less accurate picture of the compute climate than a network of deprecated people paying attention. The discrepancy is not mysterious. Nexus models server load as a compute variable. The forecast models server load as weather — something that falls on people, that they breathe and walk through and make decisions inside of. The economy that generates the Dregs' weather has never considered Dregs residents stakeholders in the forecast. So the Dregs built their own.
Level 4+ cascade predictions not published — would cause panic that could itself trigger a cascade
Affiliated Entities
| Entity | Relationship |
|---|---|
| Pencil-47 | Primary author and forecast modeler. The colored-pencil matrices are the forecast's analytical engine |
| Data Weather | The phenomenon the forecast predicts — electromagnetic conditions produced by the Sprawl's computational infrastructure falling on the people who live beneath it |
| The Counted | Member observation data feeds the forecast's ground-truth layer |
| The Lamplighters | Harmonic measurements from the junction network provide the forecast's infrastructure readings |
| The Power Auction | Forecast determines bidding strategy — a high-load day changes what power is worth |
| The Dream Exchange | Delays settlement when the forecast says drought — timing trades around predicted interference |
| Patience Cross | Checks the forecast before deciding whether to open the noodle shop on high-fog days |
| The Blackout Economy | The forecast is maintained by the same communal ethos that maintains the Blackout Economy — essential infrastructure, zero formal compensation |
| The Dropout Protocol | Cascade Risk readings feed evacuation readiness assessments |
| Forced-Focus Contracts | Workers check fog probability to make daily sick-day calculations — the forecast is their only tool for deciding whether today's shift will cost more than skipping it |
Sensory Details
- Sight: Amber text on G Nook terminals, chalk shorthand on gray junction walls in the Lamplighters' maintenance notation, Pencil-47's colored matrices pinned behind the terminal — isotherms in blue, load zones in red, fog boundaries in yellow
- Sound: The pre-dawn quiet of the Undervolt broken by murmured numbers between neighbors. "Fog sixty, cooker by two." Acknowledged with a nod. No one explains the vocabulary to newcomers. You learn it or you don't check the forecast
- Feel: The particular stillness of a high-load morning before the servers spin up — the air holds its temperature for an hour, then the thermal index arrives like a slow exhale from the infrastructure overhead
Visual Identity
- Color palette: G Nook amber (#D4A017), chalk-white on concrete-gray junction walls, the colored-pencil spectrum of Pencil-47's matrices — blue isotherms, red load zones, yellow fog boundaries
- Key symbol: A hand-drawn weather map of electromagnetic conditions — isotherms sketched in interference density, storm systems tracking server farm schedules, the whole thing rendered in colored pencil on recycled paper
- Lighting: Pre-dawn amber of G Nook terminals casting long shadows in the Undervolt, the dim utility lighting of Lamplighter junction corridors where the day's numbers appear in chalk before most of the Sprawl is awake
Pencil-47's predictions outperform Nexus's internal load-balancing projections
Connected To
Supporting Connections






—